Mapping a Social Innovation Ecosystem in Portugal
with: Filipa Carlos
Context: How we got here ?
In February 2017, we posted an article called “Activism and the New Science”where we explored the power of social network analysis (SNA) in a context of civil society movements. We explored how these types of analysis could contribute, by looking under the hood of these collaboration ecosystems, to the resilience of networks formed between people who share a common purpose.
Social network analysis is usually confused with the digital social network analysis, where we are interested in the way people interact and share information on social media. While the latter field has seen a growing interest due to the availability of data from social media, network analysis is a broad field of study that is applicable to any system that can be modelled as elements (or nodes) and relations (or connections, edges) between them. Social network analysis relates to the application of network science to the issue of how people create connections, share information and collaborate through webs of invisible personal ties.
We received a lot of feedback on this former article and we have spent a year exploring how we could improve this analysis by combining it with agent based modelling of social networks, applying these ideias to other contexts such as conflict transformation and developing further tools and processes to capture data about the network itself.
While SNA usually involves taking a “snapshot” of the network in a given point in time, computer modelling, specifically agent-based models, can be used to understand the dynamics of these networks. It allows us to research questions such as how do ideas spread, how to behaviours become popular, why to clusters of people form and how is the network structure likely to evolve.
We hold firm to our belief that SNA should be the method of choice when we are tasked with measuring the impact of social innovation initiatives.
This article is an expansion of this previous work as we explore another case-study. This time around, we used SNA and network mapping around a social innovation event in Portugal called “Everyone a Changemaker”.
Can we use an event as a way into mapping the ecosystem; people, skills and relationships? Can the event be a method for having impact on the social network structure; are people meeting each other and creating new weak ties? Can we quantify all of this?
If you share these questions when thinking about how to approach social systems, then read on.
The Case-study: Team-Entrepreneur Consortium
In May 2018, Ashoka Portugal, Catholic University of Lisbon, Polytechnic Institute of Leiria, Catholic University of Porto, IPAV, Fundação Montepio and Escola Superior de Educação Paula Frassinetti joined forces around a consortium for the promotion of team-entrepreneurship and social innovation in Portugal. The goal was to disseminate the idea that entrepreneurship, now a buzzword in Portugal, is never a one-man show but rather an effort of a team of people acting in a collaboration ecosystem.
This sounded like it is right up our alley, so we joined the initiative which kicked off with a three day roadshow called “Everyone a Changemaker”, which called upon the need and importance of collaboration for social innovation. The roadshow started in Lisbon, passed through Leiria and ended in Porto. The events where public, free to attend and called upon the agents which where active in the social innovation ecosystem in these three cities of Portugal.
This was a great chance to capture a snapshot of the ecosystem while, at the same time, understand if network analysis can say something specific about the impact of such an event.
Participatory social network mapping was the method of choice, and the complete methodology adopted for the Team-Entrepreneurship Consortium SNA is described below.
Methodology
Since we had joined the team early on, we had the chance to be involved in the preparation of the sign-up forms where we included a simple yes or no question: “Would you be interested in participating in an experiment around Social Network Mapping? “
Participants where invited to participate in the mapping exercise and where given the chance to opt-in to the experiment.
For participatory data gathering we used the web application Sum-app. Sum-app allows the network cartographer to interact with the participants in a simple and straightforward way. The participant is invited to add a picture of him- or herself, a short bio and then answer a survey designed by us that included two main questions:
- What skills/talents can I offer to the network;
- What skills/talents I would like to have from the network.
Finally, the participant is taken to a grid view of all the other participants in the event. Connections are then created by selecting one profile and answering again very short survey about the nature of the relationship the participants have with each other, being able to choose among the following options:
- “I know this person and I currently collaborate with her/him;”
- “I know this person and I collaborated with her/him in the past”;
- “I know this person although I have never collaborated with her/him”;
- “I do not know this person but I would like to meet her/him.”
These four types of connections, that participants could select, express different strengths between people; from the strongest one (type 1-“I know this person and I collaborate with her/him presently;” , strength 4) to the weakest one (type 4-”I do not know this person but I would like to meet her/him”, inexistent, strength level 0).
A good feature of Sum-app, is that it creates a real time interface file (a JSON file for all you techies out there) that feeds directly into Kumu, our preferred online network visualization platform. This means the map’s visualization is updated in real time and participants having the link to the Kumu map, may watch the network weaving unfold as they participate in the mapping exercise
During the event itself, namely during the coffee breaks, we would go on stage and invite participant to access they Sum-app profiles and share their details while a version of the map was shown on the main stage’s screen. We found that this was critical to increase participation in the exercise. We held a Network weaving workshop that further contextualised our work.
Finally, one last reminder was sent out after the event to all participants, inviting them to update their status on the network, now that they were better informed about the mapping exercise and have met the Hivemind Intitute team over Lisboa, Leiria and Porto. A fifth type of connection option was added to the survey this time, so that participants could indicate whether they had made any new connections during the event.
5. “I have met this person during the event”
With the terminus of data collection we were able to elaborate on different analysis, according to Sum-app results, Kumu dynamic visualization and Gephi SNA.
The results of all this exceeded our wildest expectations. You can see the actual Kumu map here.
Reports on participation
We were extremely interested in capturing the essentials of the network before and after the event. In particularly we wanted to measure the impact of the roadshow in the forging of new connections.
Alas, this was the main purpose of the event: to promote network weaving behaviour and collaboration when tackling complex social problems and promote a positive change on our society, under the motto “Everyone a Changemaker”.
Generally speaking, the engagement with the mapping exercise was great, with 60% of participants actually logging into their personal profiles on Sum-app. From these 60%, only half was actively completed their bio and profile, which was required in order to be recognised by the rest of the people on the network.
Here is a summary of the numbers:
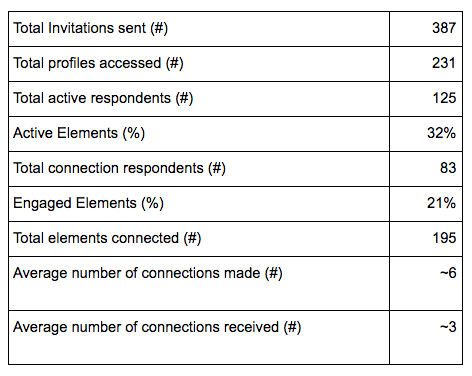
As all the participants on the mapping exercise voluntarily agreed in participating, it was expected that they would be curious enough to enrol in the process and identify at least one kind of connection with some other participant. However that was not immediately the case and some “nudging” had to be done during the event…
Three snapshots of the network
We considered three different moments in time, Moment 1,2 and 3, described below.
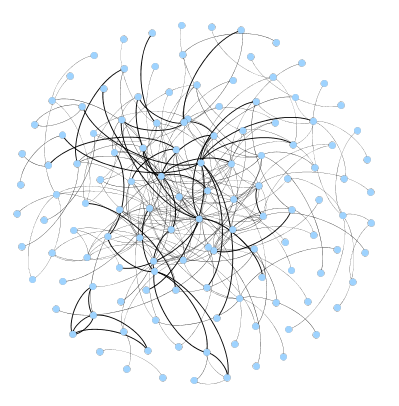
Moment One (M1) — Immediately before event
This first “moment” is a snapshot of the network immediately before the roadshow started. It allowed us to observe the engagement of the participants with the exercise without any direct, personal communication from us.
By this time a great majority of the connections established was of the type “I do not know this person but I would like to meet her/him”, which created the expectation that the event might be the place where the connections become real.
If we exclude all the orphan elements, elements that have signaled they wanted to participate in the mapping but hadn’t provided any information yet, we get the mini networks of Figure 2.
Moment two (M2) — Immediately after event
This time period was chosen to assess the relevance of the event on the networking exercise. This snapshot was taken immediately after the event had finished.
In fact, during the event, participants were able to understand the importance of the mapping exercise, which lead to an increase on the number of elements participating actively on the mapping exercise during the three days of the roadshow. The number of elements with connections increased to 146 (+78%) while the total number of connections reached the 385 connections (+128%).
Moment Three (M3) — One week after event
Two days after the event, a last reminder was sent to all participants to incentivize their final participation. We included a new type of connections, reflecting the ones made during the event. M3 represents the final configuration of the network one week after the event.
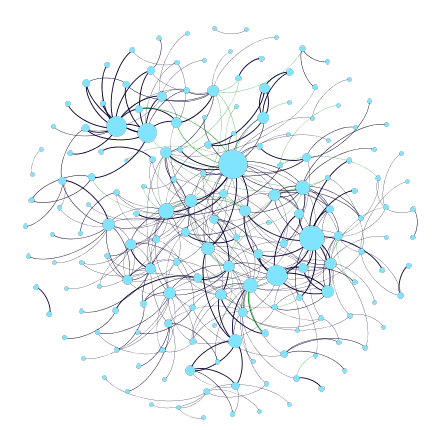
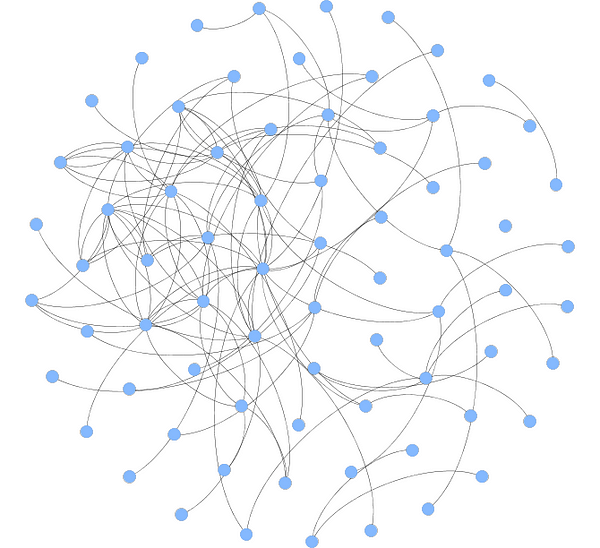
This final network is shown in Figure 4 and it shows a slower growth than the one observed at M2, as it is formed by 195 elements (+33%) and 564 connections (+46%). Moreover, from the 179 new connections identified, only 33 (18,4%) correspond to the new type, i.e, connections made during the event and are represented in light green.
Summary of network structural metrics
After all the talk above, here’s what you need to know about the network evolution in numbers. We distinguish between M3 and M3* where M3* is the analysis of the network including the potential “I would like to meet” connections. This is a optimistic “what if” scenario in which participants actually made it to actually meet the people they identified in mapping as ““I do not know this person but I would like to meet her/him.”.

Here’s a brief glossary of the above terms:
1- Nodes: total number of people in the network
2- Edges: total number of connections established between people in the network
3- Density: ratio between total number of edges and the theoretical number of possible edges if all nodes where connected to each other.
4- Diameter: the shortest path between the two most distant nodes of the network. Gives you an idea of how many people, on average, lie between two people on the edges of the network.
5- Average Degree: average number of edges (or connections) each node (or person) has. This includes connections made and received.
6- Average weighted Degree: same as above but this time weighted using the strength of the edges the point to or from the node.
Characterising the Ecosystem
DISCLAIMER:
It is important to note here that nothing can be truly stated about the actual social network formed by the participants. This will forever remain a mystery as it is impossible to collect all the data from people’s social connections.
What we can do, is to make statements regarding the evolution of the mapping exercise, how the event contributed to the map and how our personal, live invitation and demo contributed to the buying in of the participants into the exercise.
From the network formed around the event Everyone a Changemaker, it is also useful to understand the role that different people have on the network and how their role evolved over the time of making the graph.
Using Gephi to perform social network analysis, we’ve taken a look at how the key metrics evolved from Moment 2 (M2) to Moment 3 (M3) for the top five elements.
We’ve anonymised the names for privacy concerns and limited our analysis to the top 5 nodes
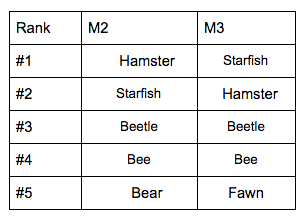
The tables below show this ranking for the two moments when considering all existing connections.
The “Social Hubs” — Degree Centrality
The elements that have the highest number of connections (measured by degree centrality) are those that act as social centers of the network, having around them a significant number of other elements and therefore being able to act as local connector. We show here only the ranking by weighted degree, ignoring the directionality of the connections.
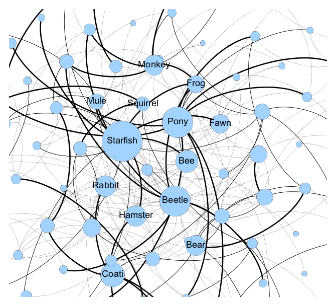
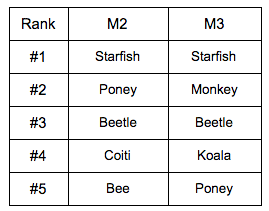
Starfish maintained its position as the node with more connections and there is a new element (Monkey) that was clearly very visible during the event and therefore climbed up to the top 5 ranking of degree centrality.
The “Pop-Ups” — Betweenness Centrality
The Pop-Up elements are identified using the betweenness centrality, and we called them that way as they are the elements that most of the times appear on the shortest path between two other elements.
Betweenness measures how strong that node’s role as broker or bottleneck is. Nodes with high betweenness detain some level of control over the flows within the network.
Remember that high betweenness doesn’t necessarily mean high visibility, importance or even gregariousness. Sometimes it is the absolute opposite. These are usually the “unsung heros” or “the sand in the works”. There should be no statement made about Starfish’s popularity of even role during the event. But clearly, the event had an effect of linking Starfish to different subclusters of the network.
Matching skills available with their demand
The event Everyone a Changemaker was all about promoting collaboration. Some of the best ways to trigger collaboration is by:
- Sharing common interests and motivations
- By revealing win-win situations, where you skills match someone else’s needs.
Both of these questions were included on our survey; in addition to asking about one’s interests, the participants were asked about the skills/talents that they could offer to this changemakers’ network and the skill/talents they would like benefit from the network.
We matched the skills requested with the skills offered and plotted both on the chart below.
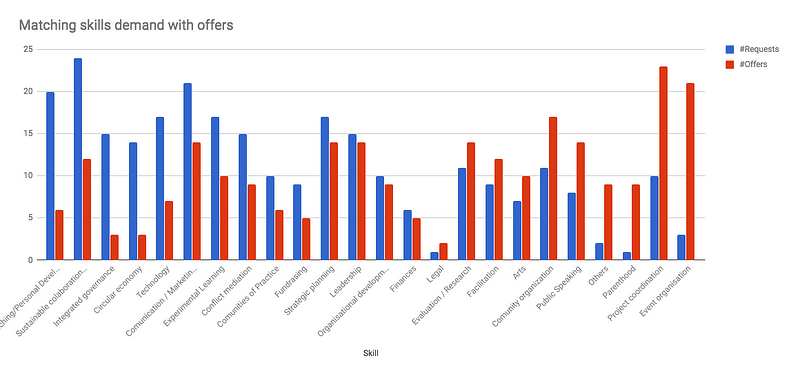
Personal development and coaching, Sustainable collaboration and integrated governance are high on the demand list but are unmatched in the size of offer. In the opposite end, there appears to be a lot of people offering skills of event organization, project coordination and parenthood that don’t have a corresponding match in requests.
Below is a chart where we subtracted the #Offers from #Request to get a sense of how balanced and unbalanced is the “internal market” of skills: apparently leadership, organizational development and finances are pretty much covered in this ecosystem
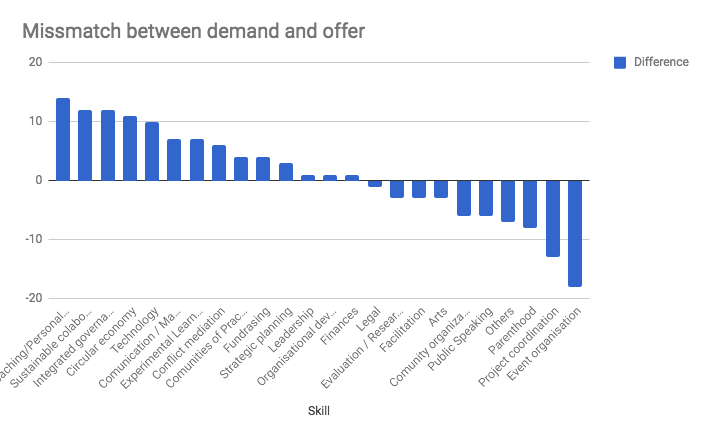
It was possible to observe that the network has a matching potential of 44% as all the 25 different types of skills and talents are present on both lists (offers and needs), although only on 10 of those skills the offers surpass the needs.
Of course this analysis is very limited because one person can provide training for hundreds of people.
But it is very interesting to think how this information can be used to strategically design training opportunities for the ecosystem.
Final thoughts
Using SNA for Impact Assessment
From all of the question we posed to participants, the one we were most curious about was whether new ties were being forged during the event. We know from Granovetter’s work on the Strength of Weak Ties that it is these new connections, established in serendipitous conditions, that have the potential to be transformative and spark innovation. This is especially so in the context of social innovation ecosystems.
Although the event did not include a specifically designed networking moment, except for the coffee breaks, people did naturally connect.
From the analysis above we dare to make the following statements:
- The event changed slightly the network structure increasing connectivity and increasing a few nodes’ centrality. This was a desired outcome and was expected given the visibility these elements had during the event.
- The event contributed to the establishment of at least 33 new weak ties in the ecosystem. It would be interesting to follow up on these weak ties to see how they evolve over time.
- About 300 new weak ties remain to be created and a carefully designed and facilitated network weaving moment during the event the could have contributed to this. This is the yet untapped potential of the network. How can we promote these new connections?
- This exercise contributed to a better perspective on the social innovation ecosystem and it currents skills and needs, providing hints as to where we should invest our training budget.
Next steps for network weavers
So, what is next?
Our motto is “keep weaving”. And that is our final recommendation to all of you who participated in the mapping. As stated above, there are about 300 weak connections to be forged. Check out our Kumu map, find your name and check who is wanting to connect with you. Engage in the discussion using the comments box under your profile. Share your social media profiles, update your bio and connections. Be curious about who is wanting to meet you.
We are also aware that for some participants, expectations were high, trying to understand how to make the best use of the network formed around the event. Ignition is the keyword: how to ignite the kindling of the weak connections? Connections can be strengthened by having common purposes and ideas but nothing does it better then working together. Simply doing “stuff” together like organizing a think thank and meet ups around topics.
Innovation is a product of serendipity, weak ties and a pinch of purposeful action. Network weaving to promote serendipity and weak ties is all in your hands. As long as you weave purposefully.
We are doing our part!
originally published at Medium on June 6, 2018